 Today, I just saw that Google released their Chart API. Basically, the Google Chart API allows you to dynamically generate charts for use in your web applications. All you do is pass your data in the querystring and an image is returned. This isn’t really a service to get too excited about, but it is pretty simple to use. And, it’s Free.
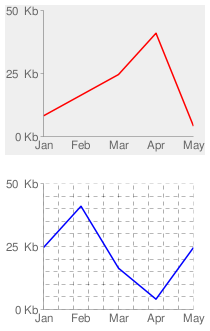
I decided to code up a small ASP.NET Server Control that uses the Google Chart API to put simple line graph charts on a page. The image on the right is actually a screenshot I took after using my new control to add a couple charts to a page.
How to use this control:
Put the Chart control on the page:
«/span>GoogleAPI:Chart runat=”server” id=”Chart1” Width=”200” Height=”150” LineColor=”ff0000” BackgroundColor=”efefef” ToolTip=”Hello World”> </GoogleAPI:Chart>
In the page load event define the values to be charted
Chart1.MaxValue = 60;
Chart1.Values.Clear();
Chart1.Values.Add(“Jan”, 10); Chart1.Values.Add(“Feb”, 20); Chart1.Values.Add(“Mar”, 30); Chart1.Values.Add(“Apr”, 50); Chart1.Values.Add(“May”, 5); Chart1.YAxisLabels.Add(“0 Kb”); Chart1.YAxisLabels.Add(“25+ Kb”); Chart1.YAxisLabels.Add(“50+ Kb”); </span></span>
And, that’s all you have to do to put a Chart on your page using my little control.
This source code is licensed under the Creative Commons Attribution 3.0 United States License.
